Tracking Change from Above: What Time-Series Drone Imagery Reveals About a Site
How a sequence of flights tells a story that a single image cannot
A single drone flight gives you a snapshot. It shows what is on the ground at that moment: the shape of a building foundation, the extent of stockpiled materials, the pattern of vegetation. But most site managers need more than a snapshot. They need to understand how the site is evolving over weeks, months, or years. That is where time-series drone imagery comes in. By capturing the same area repeatedly and lining up the images so they align perfectly, you can compare conditions across different dates and see exactly what has changed, what has stayed the same, and how fast things are moving.
Time-series drone imagery is not just a collection of old photos. It is a structured data set where every image is georeferenced so that a point on the ground appears in the same pixel location every time. That alignment makes it possible to overlay images, subtract one from another, and measure differences down to a few centimetres. For anyone managing a construction site, a quarry, a farm, or an environmental restoration project, this kind of comparative view is far more useful than a single survey.
What makes time-series drone imagery different from ordinary photos
A standard aerial photo is a useful record, but it is hard to compare with another photo taken from a slightly different angle, altitude, or time of day. Even small shifts in the camera position can make two images look like they are from different places. Time-series drone imagery solves this by processing each capture into an orthomosaic. An orthomosaic is a geometrically corrected image where every pixel is mapped to real-world coordinates. Once you have orthomosaics from multiple flight dates, you can layer them in a GIS or a drone data platform and toggle between dates, or let the software highlight the differences automatically.
The process relies on ground control points or GPS data from the drone itself. Modern drones record position metadata for each photo, and photogrammetry software uses that data to stitch hundreds of overlapping images into a single seamless map. When you repeat the same flight plan on a later date, the software aligns the new orthomosaic with the earlier one. The result is a stack of maps that share the same coordinate system, making direct comparison possible.
What you can see with a time series that you would miss otherwise
Some changes are obvious from the ground. A new building rises, a road gets paved, a tree falls. But many changes are gradual or subtle. Erosion along a slope, slow settlement of fill material, the spread of invasive weeds, or the gradual widening of a haul road can be invisible to someone walking the site every day. A time series of drone imagery reveals those slow trends because you can step back and compare a map from last month with one from six months ago, and another from a year ago.
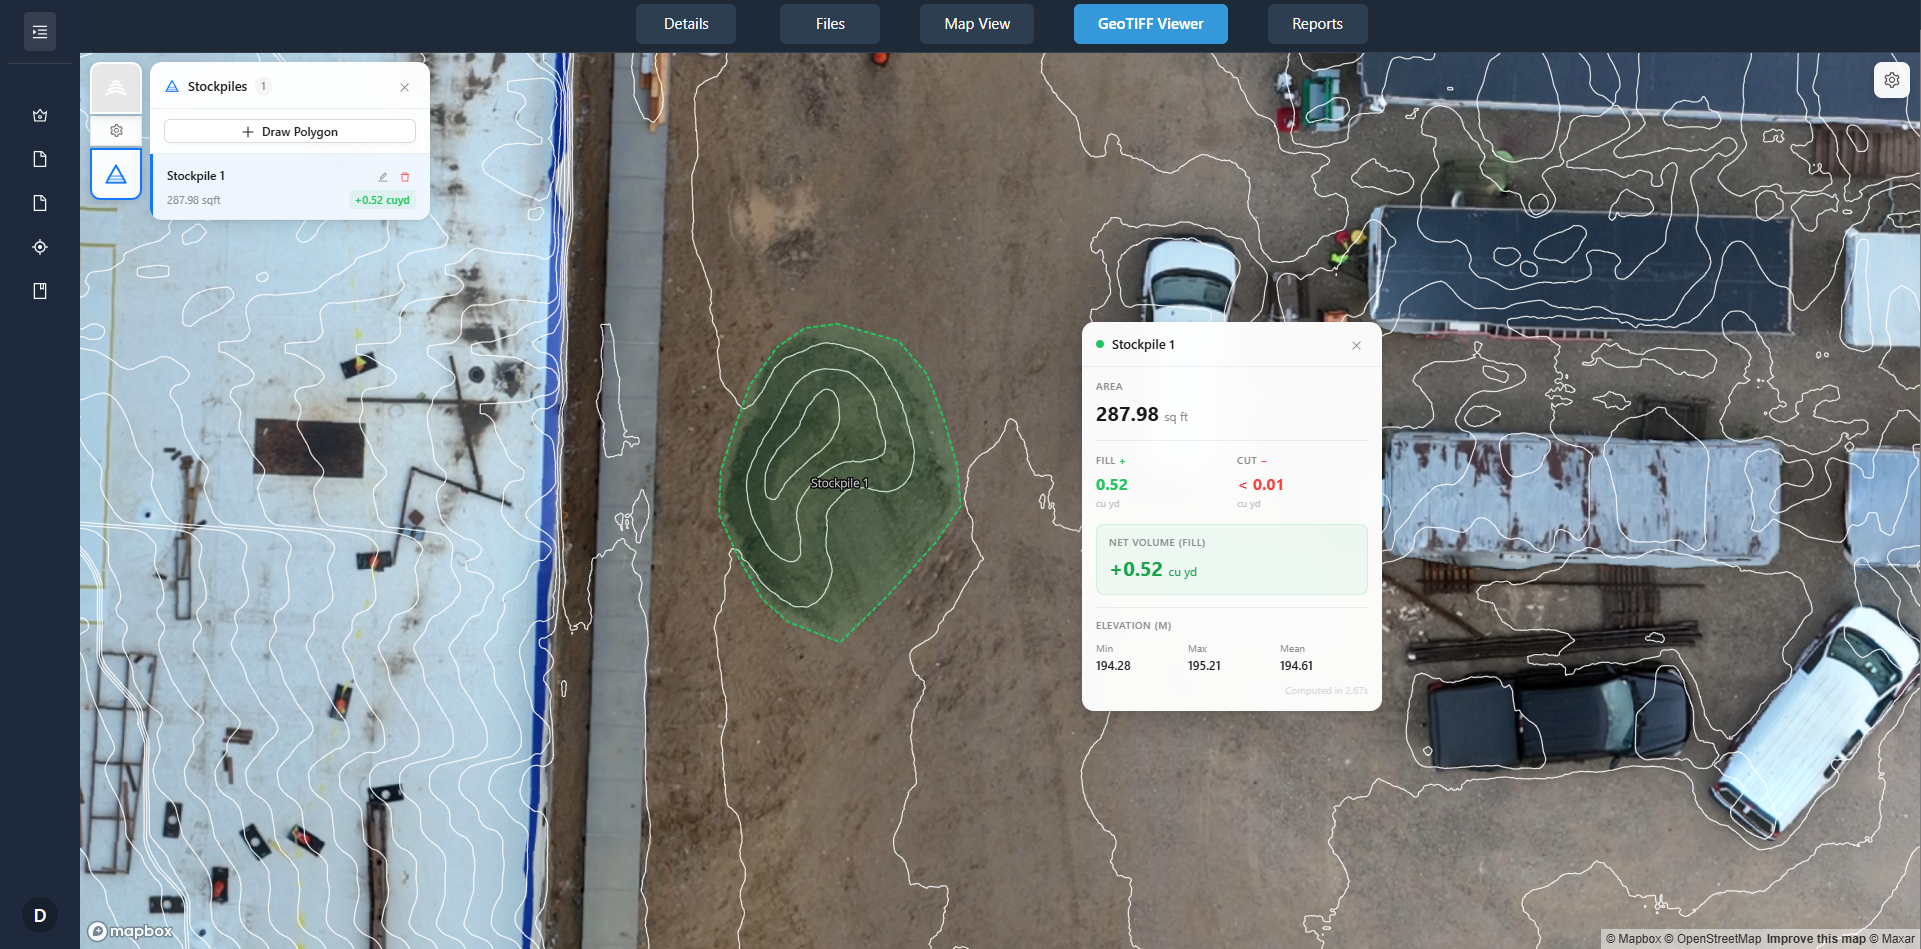
For a construction site, progress monitoring is the most common use. A project manager can overlay the current orthomosaic on the design model and see exactly how much earth has been moved, where the foundations are relative to the plan, and whether the site grading matches the specifications. The same data helps with stockpile volume calculations. By comparing the surface model from one flight date to the next, you can compute how many cubic metres of material have been added or removed.
Change detection: letting the software do the hard work
Manual comparison of two images is tedious and prone to error. The human eye is good at spotting large differences but can miss subtle shifts. Change detection algorithms automate the process. They compare two orthomosaics pixel by pixel and produce a difference layer that highlights every area where the surface has changed. The output is often a colour-coded map where red shows material loss, blue shows material gain, and grey shows no change. This kind of map is invaluable for environmental monitoring, where regulators want proof that a site is not eroding into a waterway, or for quarry operations that need to track how much stone has been extracted.
Change detection works best when the flights follow the same parameters: same altitude, same camera angle, same time of day if possible. Shadows and lighting differences can create false positives. A good drone data platform allows you to normalise the images so that brightness and contrast are balanced, reducing the noise in the change map.
Building a project timeline from flight data
Each flight date becomes a chapter in the site's story. By organising the orthomosaics along a timeline, you can scroll through the history of the project the way you would scroll through a photo album. This is especially useful for reporting to stakeholders or regulators. Instead of describing what happened, you can show them a sequence of maps that documents every phase of the work. A time-series viewer in a data platform lets you click on a date and see the corresponding image, or play an animation that runs through the entire sequence.
For a construction manager, the timeline also helps with dispute resolution. If a subcontractor claims that a certain area was already compacted when they arrived, the orthomosaic from the relevant flight date can confirm or refute that claim. The imagery becomes an objective record that does not rely on anyone's memory.
Practical considerations for setting up a time-series capture programme
Getting useful time-series drone imagery requires consistency. You need a repeatable flight plan that the drone can follow automatically. Most modern drones support waypoint missions or polygon surveys that you can save and reuse. The same flight plan flown at the same altitude will produce images that overlap in the same way, making the orthomosaics easier to align.
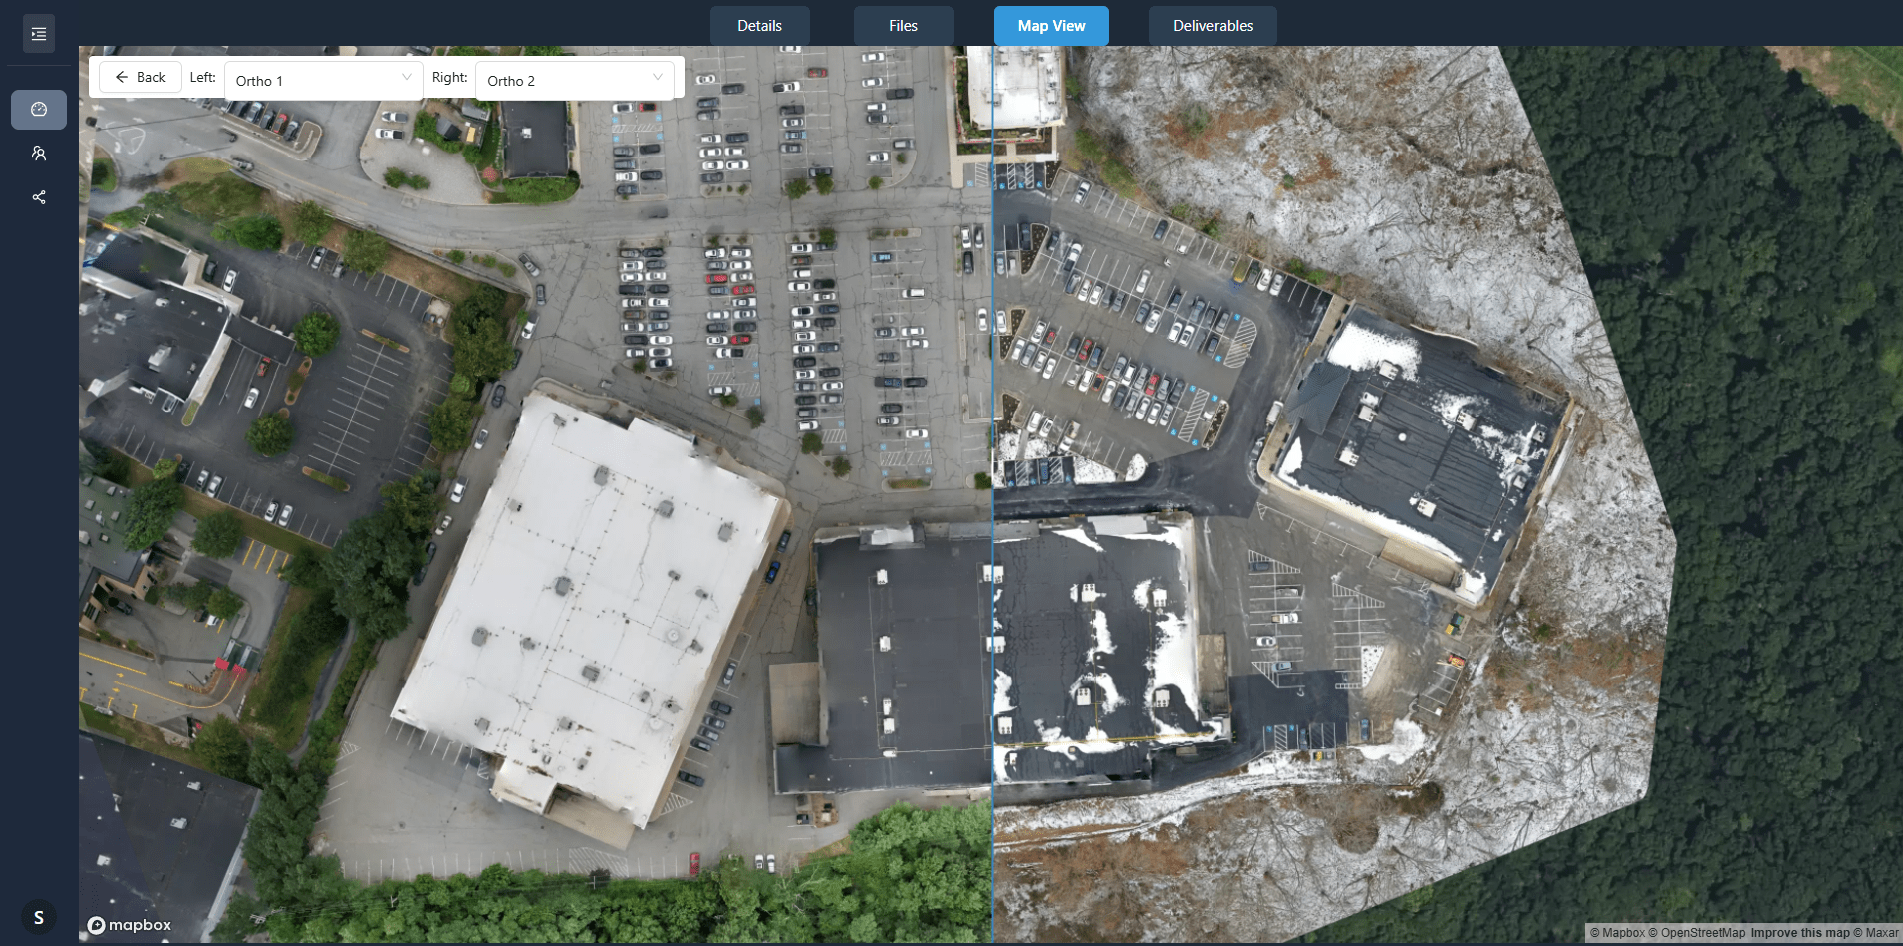
The frequency of captures depends on the rate of change on the site. A fast-moving construction project might need weekly flights. A quarry that blasts every month might need one flight after each blast. An environmental restoration site might be fine with quarterly flights. The key is to capture often enough that you can see the changes when they happen, but not so often that you drown in data.
Data management becomes important once you have multiple flights. Each orthomosaic can be hundreds of megabytes. Over a year of weekly flights, you are looking at gigabytes of data. A drone data platform like DataDelivery helps by organising the captures, storing the orthomosaics, and providing tools to compare them without having to download everything to a local drive. The platform also handles the georeferencing and the change detection processing, so you do not need specialist software on your own computer.
National Drone Services is one provider that works with such platforms to deliver processed imagery directly to clients. Their role is to capture the data in the field and hand off the raw images to the processing pipeline. The client then accesses the orthomosaics and comparison tools through the platform, without needing to manage the technical steps themselves.
Site annotation and collaboration across the team
A time series is most valuable when the whole team can use it. Site annotation tools let users mark up the orthomosaic with notes, measurements, and flags. A project engineer might draw a polygon around an area that needs attention and attach a comment. That annotation is tied to the specific flight date, so anyone who looks at that image later sees the note in context. Over time, the annotations themselves become a record of decisions and observations.
Collaboration works best when the data lives on a central platform rather than on someone's hard drive. The platform controls who can view, annotate, or download the imagery. It also keeps a log of who made each annotation and when, which is useful for accountability.
What time-series drone imagery means for your project
If you are managing a site where conditions change over time, a single survey is not enough. Time-series drone imagery gives you a documented history that you can refer back to, measure against, and share with others. It turns drone flights from a one-off expense into an ongoing information asset. The upfront effort of planning a repeatable flight programme pays off when you need to prove compliance, settle a dispute, or simply understand how the site is behaving.
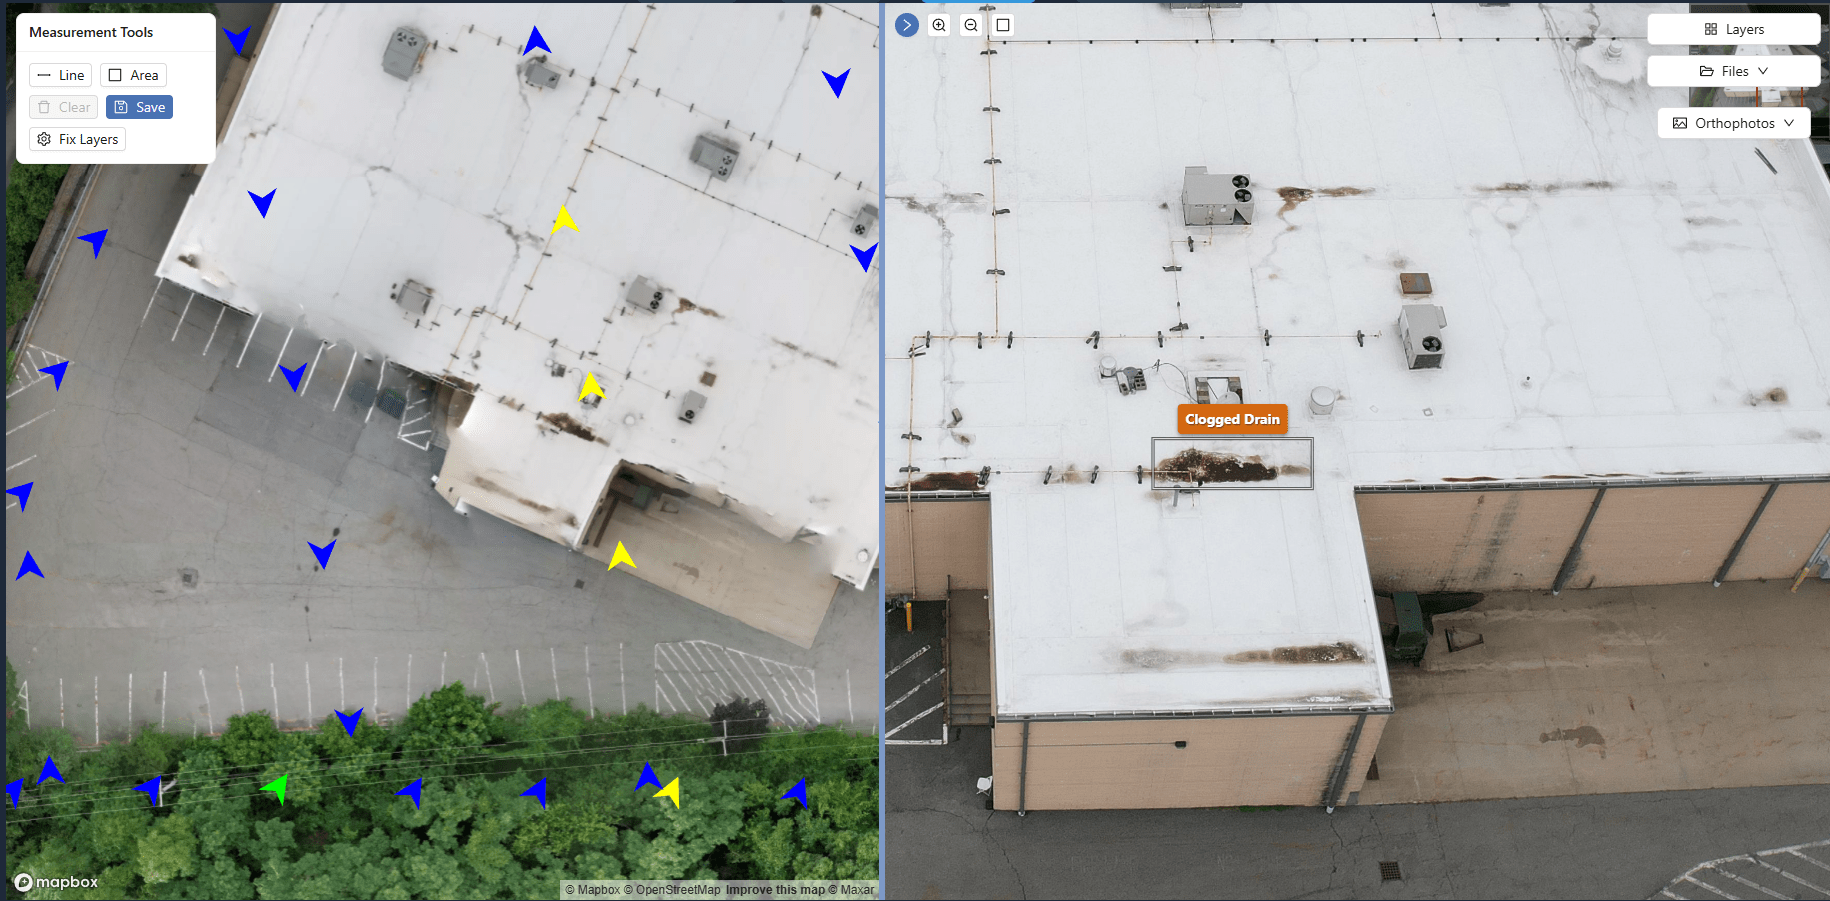
National Drone Services can handle the field capture side of that programme, but the value ultimately comes from the way the data is processed and presented. A platform that aligns the orthomosaics, runs change detection, and provides a timeline viewer makes the time series useful for decision-making rather than just a stack of files.
For anyone who needs to track progress, monitor environmental conditions, or document site history, time-series drone imagery is a practical tool. It gives you a record that is consistent, measurable, and easy to communicate. And because the data is georeferenced, you can combine it with other spatial data such as design drawings, survey points, or regulatory boundaries. The result is a complete picture that a single photograph or a written report cannot match.
Ends · DRONESITEJOURNAL